Tool introduction
Checkpoint end-user performance testing tool and task runner
A performance testing tool for the team, plus an invitation to add to it.
This is a pull request I opened at InterNations. It is laid out below the way my colleagues would have come across it: as a review page, at the point where they had to decide whether to take the change on.
The description is the part on display here. The diff that went with it is private, and links to the repository and to our internal tools are flattened to plain text, so nothing below will take you somewhere it shouldn’t.
Checkpoint end-user performance testing tool and task runner#8463

Description
🛃 Checkpoint 🛃 a development tool that performs routine tasks in a headless browser.
Checkpoint handles the creation of a browser instance using Playwright, running the task multiple times, gathering user options, and tracking results. Tasks are free to do anything they’d like with the browser and to report their results in any format.
Use cases
Comparisons
Checkpoint can be helpful when you want to compare two different ‘versions’ of our site. For example, you might want to test how some change to the code will affect performance:
- Run
checkpoint lighthouse --runs 10on your branch and make a note of the results - Make some changes to the code, e.g. add a new dependency
- Run
checkpoint lighthouse --runs 10again and compare the results
You might also test for regressions in this way, e.g. by running the same task on two different deploy branches.
Lighthouse
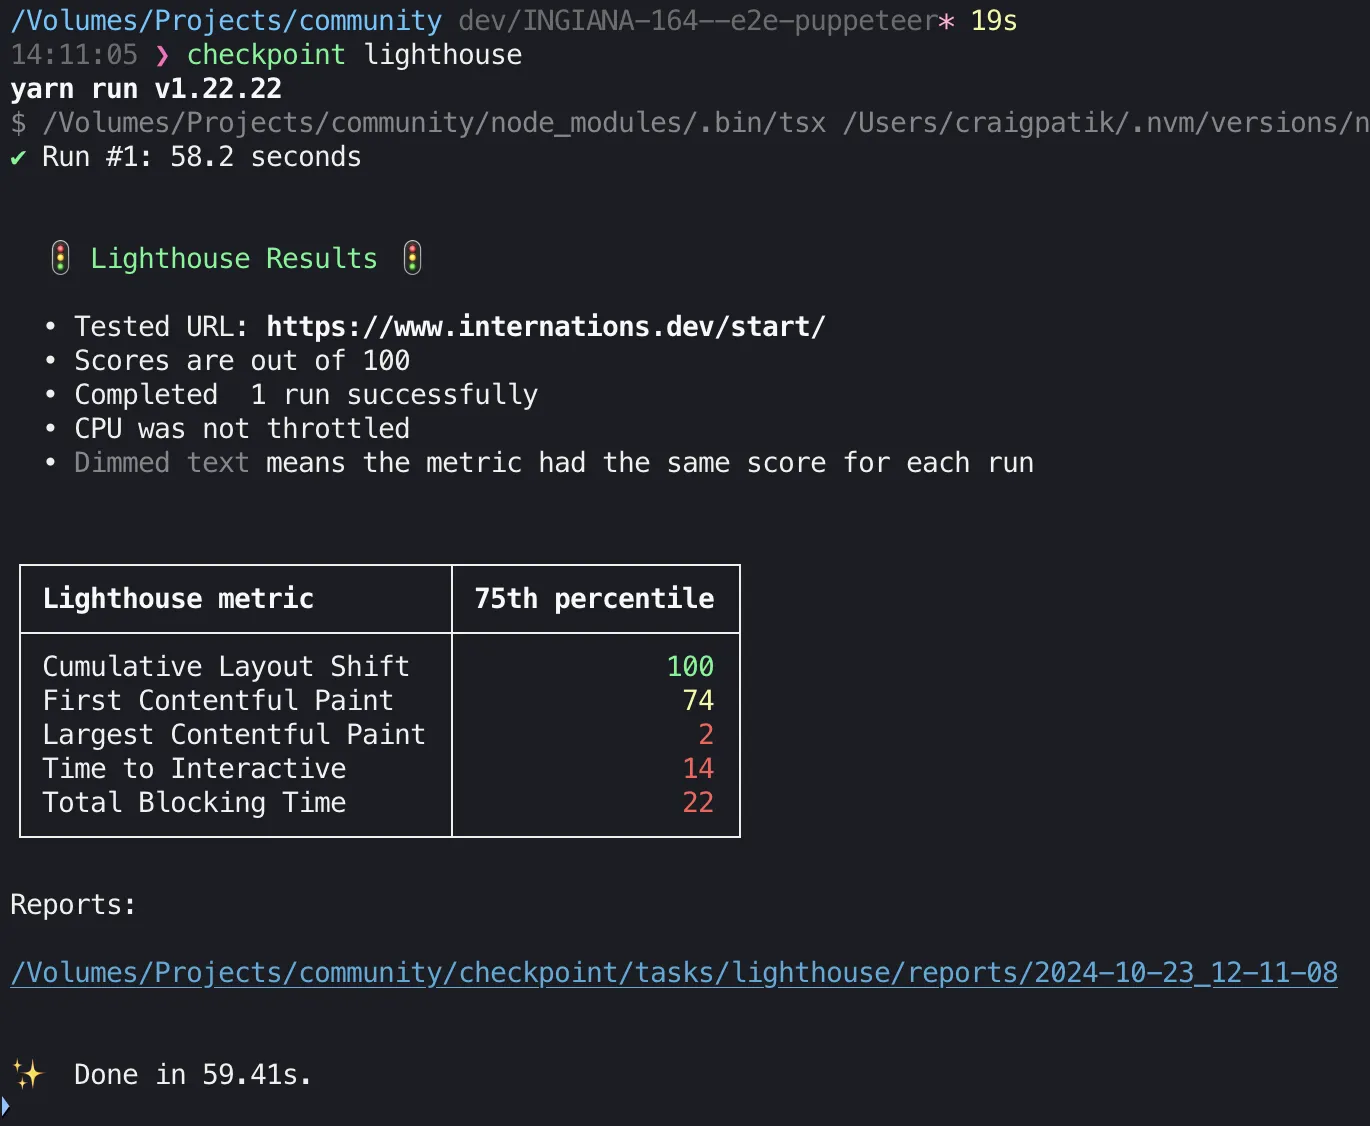
Checkpoint can run Lighthouse to measure web vitals for a given URL. It can combine multiple reports and give you the aggregate scores. For example, following best practices, you can determine the 75th percentile for the largest contentful paint.
Simulate other devices
Tasks can be run with a slower CPU (with the --cpu-throttle flag) or with different user agents or device profiles. This can be helpful in determining how the app performs for different users.
Anything that needs to be done in a browser
Tasks can perform any operation at all. Anything we want to do repetitively in a browser can become a Checkpoint task.
Examples

Running a sample task 5 times:
Example output from the lighthouse task:
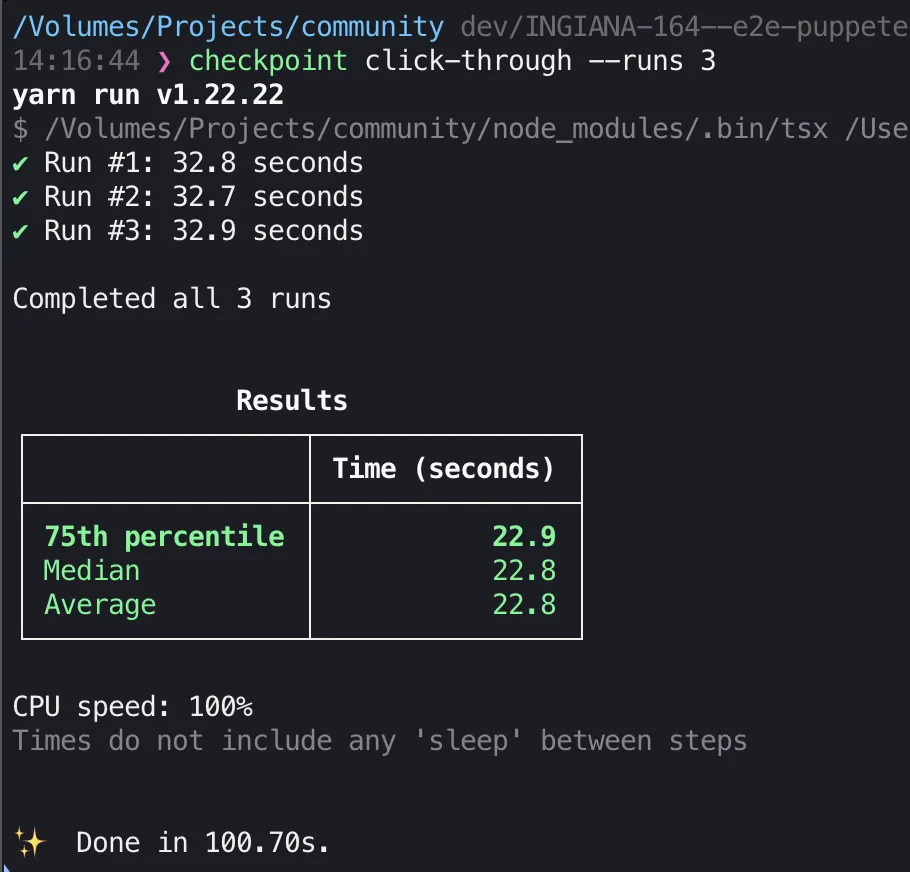
Example output from the click-through task:
Documentation
This is a copy of the README
Examples of how it can be used
- run Lighthouse and report the scores
- click through certain pages in the site, e.g. to determine how long it takes for those pages to load
- run any task multiple times, e.g. to get more accurate Lighthouse readings
- compare how the app behaves when changes are made to the frontend or backend
- take screenshots
- throttle the CPU
Usage
Call checkpoint with the name of a task:
checkpoint name-of-taskOptions
Run checkpoint --help to see all available options.
Global options
These apply to all tasks:
name-of-taskis the name of the task you want to run, which should be a path relative tocheckpoint/tasks/--runs <number>is how many times it executes the task (default to1)--guilaunches the browser so you can see it (i.e. this disables headless mode)--cpu-throttle <number>means how much you want to slow the browser down, i.e.4means it should run at 25% the normal speed (defaults to1, i.e. no slowing down)
Task-specific options
These apply to tasks that support each feature:
--verbosedisplays some extra console logs--screenshotswill save screenshots of the page while the task runs; they will be saved in a subfolder of the task called ‘screenshots’
Additionally, the standard DEBUG environment variable is supported.
Examples
# Run the Lighthouse task once with no extra output or artifactscheckpoint lighthouse# Run the Lighthouse task 10 times and display the browser while it's runningcheckpoint lighthouse --runs 10 --gui# Run the Click-Through task 10 times, with the CPU slowed down by 10 times, and print extra info along the waycheckpoint click-through --cpu-throttle 10 --runs 10 --verboseUse cases
Comparisons
Checkpoint can be helpful when you want to compare two different ‘versions’ of our site. For example, you might want to test how some change to the code will affect performance:
- Run
checkpoint lighthouse --runs 10on your branch and make a note of the results - Make some changes to the code, e.g. add a new dependency
- Run
checkpoint lighthouse --runs 10again and compare the results
You might also test for regressions in this way, e.g. by running the same task on two different deploy branches.
Simulate other devices
Tasks can be run with a slower CPU (with the --cpu-throttle flag) or with different user agents or device profiles. This can be helpful in determining how the app performs for different users.
Tasks
A task is a function. It can perform any operations you’d like as long as it returns something truthy when its successful runs and something falsy when it fails (or a promise that resolves to truthy/falsy).
The task function will be run as many times as specified by the --runs flag. It will receive a new browser instance for each run.
How to add a task
Create a file in checkpoint/tasks/ with two exports:
- default export:
task: (options: TaskConfig) => Promise<unknown> | unknownis the function that performs the task. It will receive a fresh browser context It should return something truthy if it succeeds, or something falsy if it fails. - named export:
report: (results: TestResults, metadata: ReportMetadata) => void | Promise<void>is an optional function that will be called after the test completes so it can output a report.
Run the task by passing the file’s name or relative path to the checkpoint/tasks/ folder:
# This command works for both file paths:# checkpoint/tasks/foo/index.tscheckpoint fooTasks are free to write artifacts to subfolders called reports and screenshots. Those folders are ignored by Git.
Use getScreenshotsDir() and getReportDir() to get the directory path for the current batch of runs. Reports can be generated every time, but screenshots should only be taken when --screenshots is used.
Logging from tasks
While console.log is supported and will write to the terminal, it’s preferred to use one of the following loggers to allow the user to determine how much output they’d like.
Verbose logging
These logs will only appear when the task is run using the --verbose flag.
Authoring:
import { verboseLog } from '../util/verboseLog'
verboseLog('Something happened')
Usage:
checkpoint name-of-task --verboseDebug logging
These logs will only appear when the POSIX standard DEBUG environment variable is set.
Authoring:
import createDebug from 'debug'
const debug = createDebug('checkpoint:name-of-task')
debug('Your message here')
Usage:
DEBUG=checkpoint:* checkpoint name-of-taskReports
Since every task is different, the report functions are tailored to each one. Checkpoint will simply run the task, collect its output, and pass the output back to the report for processing.
Report functions are optional and may print or output anything they’d like. For example, the Lighthouse task computes statistics by combining scores from multiple task runs, while another test might simply time how long the task took to run.
To use this feature, export a function called report from the task’s main file. The function will receive the task results and metadata.
(results: TestResults, metadata: ReportMetadata) => void | Promise<void>`Report functions will be called once, after all runs have taken place.