This is an update to the console.log wrapper; see this blog post for background and a more detailed discussion of the problems with console logging.
While logging the console can be useful during development, some browser consoles do not display logged data in a readable, useful format. These primitive consoles do not expand arrays, do not link DOM elements to the source code, print objects as [object Object] rather than listing their properties, etc.
For example, try logging the following in Internet Explorer 8 through 10:
console.log(
    "Here's a string",
    3.14,
    {"alpha": 5, "bravo": false},
    document.getElementById('charlie'),
    new Date()
);
It will result in:
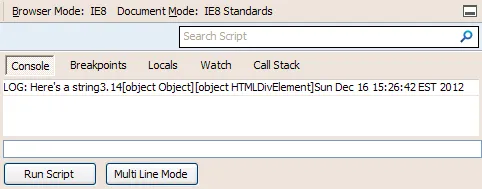
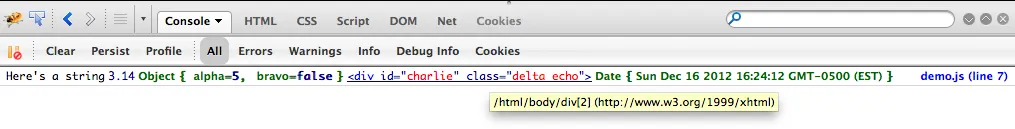
On the other hand, Firebug, WebKit’s Developer Tools, and Opera’s Dragonfly print useful, interactive items to the console. Here’s the same code as above, but this time in Firebug:
Expanded details
But it is possible to eke a bit more information out of the data in primitive consoles. I’ve added a detailed print plugin to my console.log wrapper.
By including the plugin and sending the data to log(), the same call as above now looks like this:
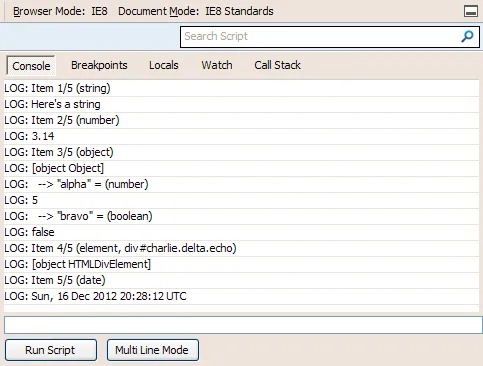
It’s still not pretty, nor is it linkable like modern consoles. But now instead of [object Object] you can see that it was an array (along with its length), or a DOM element (along with its selector), and so on. This can be useful in IE 7/8/9/10, iOS 5 and older, and Opera 11 and older, among others.
Alternatives
For iOS 5 and older, if you are so inclined you may instead try installing Firebug or using a remote debugging tool like Adobe Edge Inspect or Weinre.
If you’re sticking to modern browsers, you can simply ignore the new consolelog.detailprint.js plugin and continue to use log() as usual.
Thanks to Jörn Berkefeld for pointing out that this was needed on iOS 5 and for testing.